


From time to time, I’ll hear someone express puzzlement over my frustration with the amount of sugar in the American diet. “Just don’t eat dessert and you’ll be ok,” is one response I’ve heard.
Wanna bet? Added sugar is everywhere, and this prevalence is causing many of us, including our kids, to consume the equivalent of many, many teaspoons of the stuff on a daily basis. The consequence is that many of us, adults and kids alike, are at a significantly higher risk of a number of chronic diseases like diabetes, obesity, high blood pressure, and high cholesterol.
To satisfy my own curiosity, I decided to do an informal, back-of-the-envelope calculation of how much sugar a typical five-year-old child might actually consume in a single day. I selected a menu of items similar to what my own kids and their friends might have eaten at that age while also taking into account a parent’s concern that the food be nutritious but also convenient.
The results are astonishing. As you can see below, the amount of sugar present in this one day’s worth of food is a whopping 49½ teaspoons. That’s more than 1 cup of sugar! (Yeah, I didn’t believe it either, so I double-checked and then triple-checked this result.)
Sure, some of it is the naturally occurring sugar (lactose) in the milk, yogurt and cheese, but that amount (about 8½ teaspoons) is dwarfed by the remainder, all of which is added sugar. (I consider the sugars in 100% fruit juices to be equivalent to the sugars in soda. Even though fruit juice is derived from fruit, it is missing the fiber that is also present in fruit. Fiber significantly dilutes the amount of sugar delivered by the fruit while simultaneously slowing the body’s absorption of it. Fiber also promotes a feeling of fullness. In the absence of fiber, fruit juice is essentially soda and a vitamin pill.)
So, next time someone says that we don’t have an added sugar problem in this country, pull out the numbers below. The results are sobering.
|
Amount of Sugar* |
||
| Grams |
Teaspoons** |
|
| Breakfast | ||
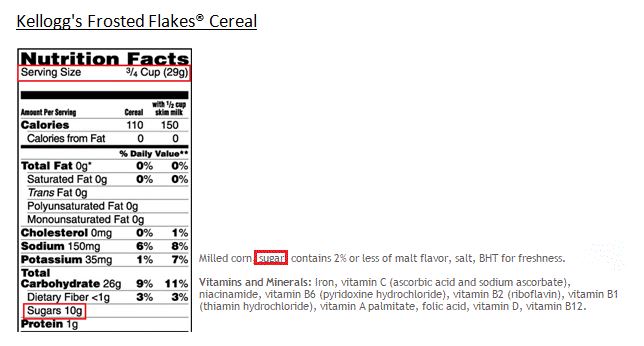
| 1 cup Kellogg’s Frosted Flakes® Cereal |
13 |
3.25 |
| 1 cup (8 oz.) of NESQUIK® Calcium Fortified White Lowfat Milk |
12 |
3 |
| 1 cup (8 oz.) of NESQUIK® Calcium Fortified Chocolate Lowfat Milk | 24 | 6 |
| Lunch | ||
| 2 slices of Arnold’s Oatnut®Bread | 8 | 2 |
| 2 tablespoons Jif Regular Creamy Peanut Butter | 3 | 0.75 |
| 2 tablespoons Smuckers’ Concord Grape Jam | 24 | 6 |
| 1 pack of Nabisco Oreo Chocolate Single Serve Cookies | 23 | 5.75 |
| Snacks | ||
| 1 pouch Capri Sun 100% Apple Juice | 20 | 5 |
| 1 pouch Capri Sun 100% Grape Juice | 21 | 5.25 |
| 1 tube Berry Blue Blast Yoplait Go-Gurt | 9 | 2.25 |
| Dinner | ||
| Panera Kids Greek Salad | 2 | 0.5 |
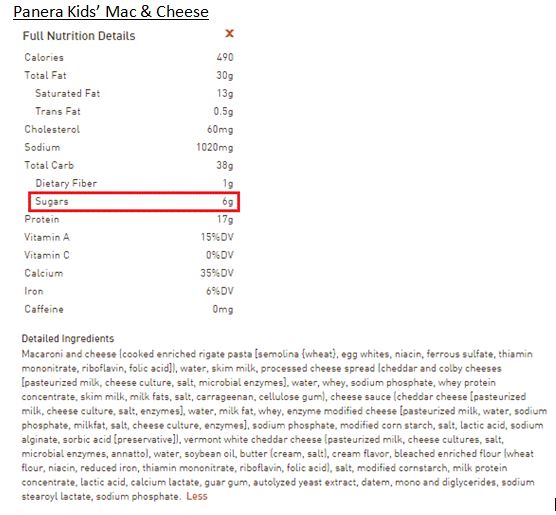
| Panera Kids Mac & Cheese | 6 | 1.5 |
| Panera Chocolate Chipper Cookie | 33 | 8.25 |
| Total Amount of Sugar | 198 grams | 49.5 teaspoons |
*All data was obtained on February 3, 2015 from company websites.
**One teaspoon equals four grams, so the numbers in this column were obtained by dividing the numbers in the column to the left by four.
BREAKFAST


LUNCH


SNACKS


DINNER


2 thoughts on “Deciphering the Label: Added Sugar”